
Fragile Starters
What happens to an NBA team, and a fantasy team, when a player is available just a bit more?
No rookies or sophomores: in the league all three seasons, played last season, on a roster now. Starters only, 24+ minutes a night, where having him back adds to the team.


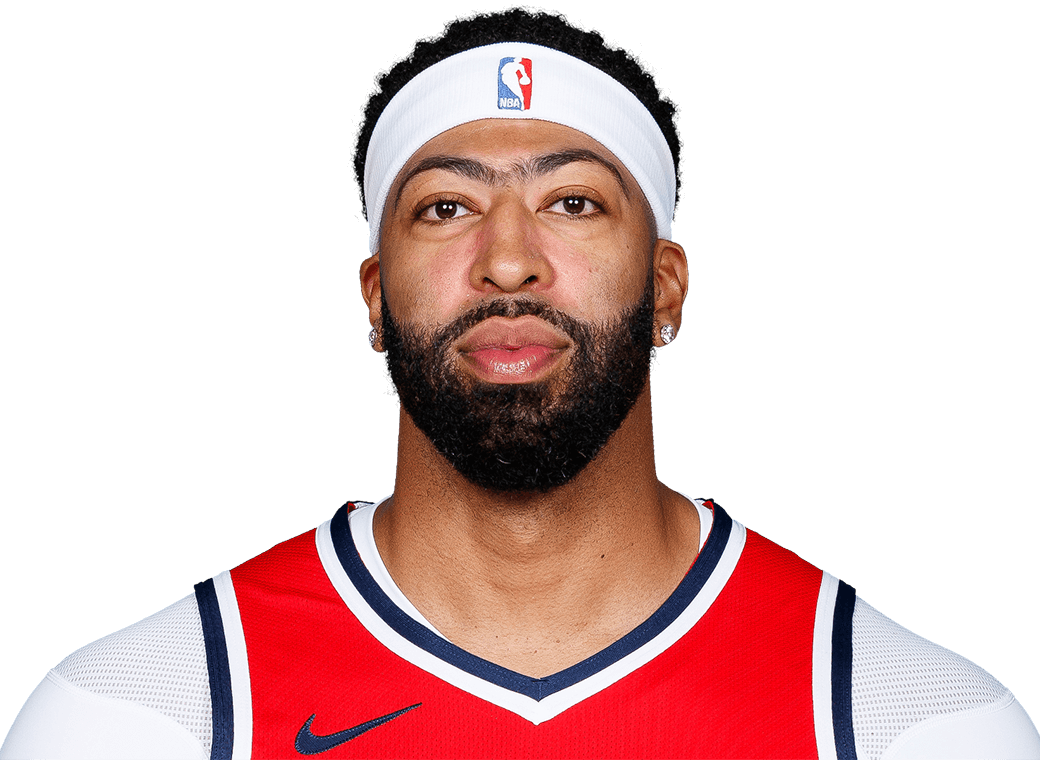

What if Joel Embiid was healthy just a little bit more
Philadelphia wins 66% with him and 35% without. Below: 10%, 20% and 30% more of him, for the 76ers and for whoever holds him. No one goes past 70 games.
Real NBA · Philadelphia
Wins per 82 games
With him the 76ers won 66% of games over 2023-24 to 2025-26; without him 35%. Each added game is won at the with-him rate.
Load Management · 9-cat H2H
His line in a fantasy week
| Cat | Per game | As it was1.4 gp | +10%1.7 gp | +20%2.1 gp | +30%2.4 gp |
|---|---|---|---|---|---|
| FG% | 48.9 | same | same | same | same |
| FT% | 85.4 | same | same | same | same |
| 3PTM | 1.4 | 1.9 | 2.4 | 2.9 | 3.4 |
| PTS | 26.9 | 36.7 | 46.1 | 55.5 | 64.9 |
| REB | 7.7 | 10.5 | 13.2 | 15.9 | 18.6 |
| AST | 3.9 | 5.4 | 6.8 | 8.2 | 9.5 |
| ST | 0.6 | 0.8 | 0.9 | 1.1 | 1.3 |
| BLK | 1.2 | 1.7 | 2.1 | 2.5 | 2.9 |
| TO | 2.9 | 3.9 | 4.9 | 5.9 | 6.9 |
2025-26 per-game line times the games he plays in a 3.5-game week. Percentages do not move; the weight behind them does.
On our rosters
Every Load Management team holding a fragile starter. Slide a player up and watch his team’s head-to-head season move.
The starters who are not there
Below are the least available players on a roster today who still average 24 minutes when they do play, with at least 30 games in the window. These are the names a fantasy manager drafts on talent and then watches from the injured list.








What it costs a team
Take every player who averaged 20 minutes across the window and group them by how often they played. The teams of the players under 55% won 44% of the games those players appeared in. The teams of the players at 75% or better won 54%. Read that second column with care: it is the win rate of the games the player was on the roster for, weighted by his games, so a star who missed a tanking season’s second half still carries that season’s record.
| Games played | Players | Average | Team win rate | Full-season win rate |
|---|---|---|---|---|
| Under 55% | 45 | 37.8% | 44.3% | 43.2% |
| 55% to 75% | 85 | 66.6% | 48.9% | 48.2% |
| 75% and up | 120 | 84.9% | 54.0% | 53.7% |
The team view is sharper. For each of the 88 team-seasons in the window we took the players who averaged 20 minutes and asked what share of the 82 games they played, then put that beside the team’s record. The correlation is 0.65. Teams whose rotation was available more than the average (75%) won 58% of their games. Teams below it won 39%. Causation runs both ways, since losing teams shut players down in March, but the Embiid arithmetic above does not need the correlation to make its point.
| Season | Team | Played | Record |
|---|---|---|---|
| 2025-26 | MEM | 34% | 25–57 |
| 2023-24 | MEM | 42% | 27–55 |
| 2024-25 | PHI | 42% | 24–58 |
| 2024-25 | NOP | 46% | 21–61 |
| 2025-26 | UTA | 47% | 22–60 |
| Season | Team | Played | Record |
|---|---|---|---|
| 2023-24 | OKC | 95% | 57–25 |
| 2023-24 | DEN | 93% | 57–25 |
| 2023-24 | MIN | 93% | 56–26 |
| 2023-24 | SAC | 92% | 46–36 |
| 2025-26 | MIN | 91% | 49–33 |
Say nice things
Every October an r/NBA thread asks which player you most want to see get through one season in one piece. Its one rule: say nice things. So. Joel, the league is better when you are in it, and Philadelphia is a different team on the nights you walk out. Rob, that 2022 version of you is still the best rim protector most of us have seen in a Celtics jersey. Anthony, Zach, you are owed one of those years where the body cooperates all the way to April. We would like to see it. The spreadsheet would too.
Every player in the window is in the availability table on the league site, with the Load Management manager holding him.
Games played and per-game lines from Basketball Reference, team records from ESPN, with and without records from Basketball Reference game logs, seasons 2023-24 to 2025-26. A traded player’s team win rate is weighted by the games he played for each team. Headshots from NBA.com.