
Running it back
Does winning an NBA championship change a team’s fantasy value when the team runs it back?
2022-232023-24
 Denver Nuggets
2023-242024-25
 Boston Celtics
2024-252025-26
 Oklahoma City Thunder
2025-262026-27
 New York Knicks
Dan in our fantasy league said:
DanI’d like to bench the whole Knicks team right now […]
That got me thinking. Does the fantasy value of a player get better or worse after he has just won a championship?
Looking at the last 3 championship teams, each brought back most of its title starting five(bar OKC, with an injury sidelining Jalen Williams for Cason Wallace). So, with the data we have, can we find out whether fantasy value takes a hit?
How much of the title five came back
DEN 2022-23 → 2023-24100% started again
BOS 2023-24 → 2024-25100% started again
OKC 2024-25 → 2025-2680% started again
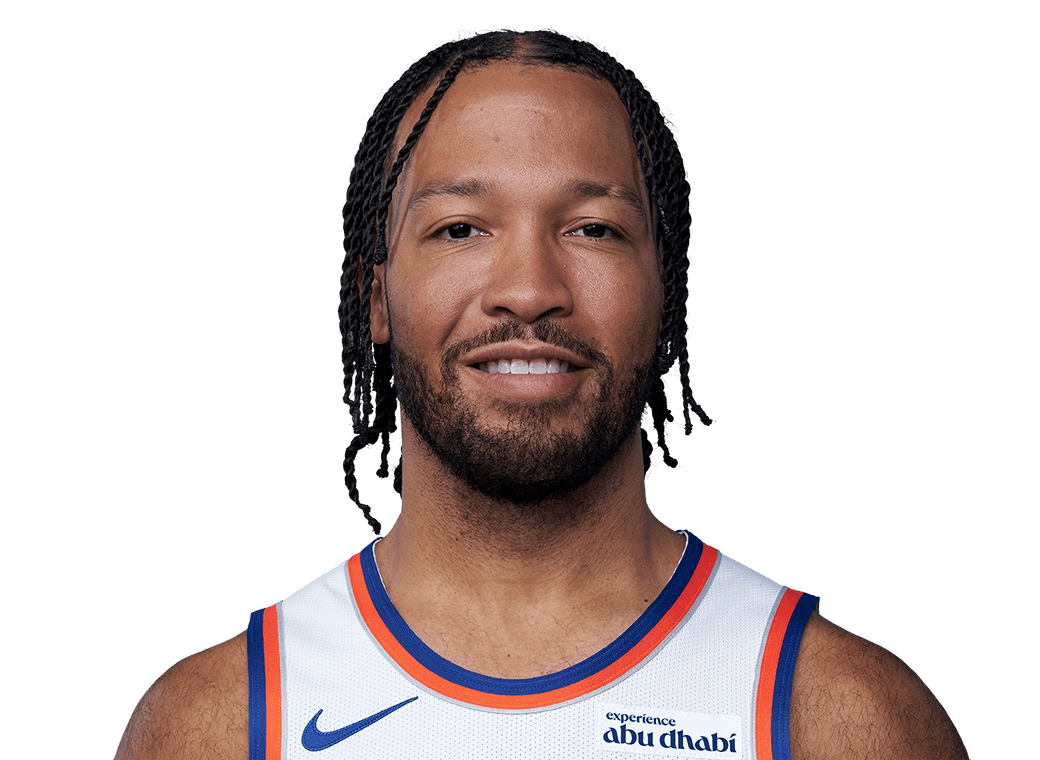
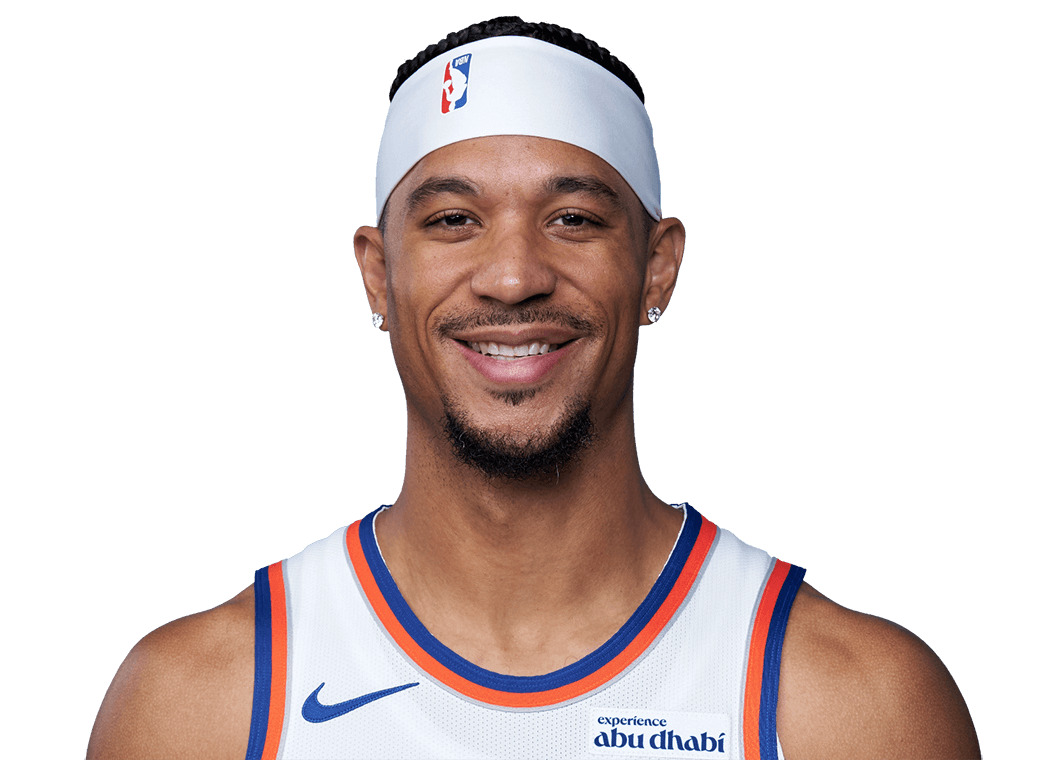
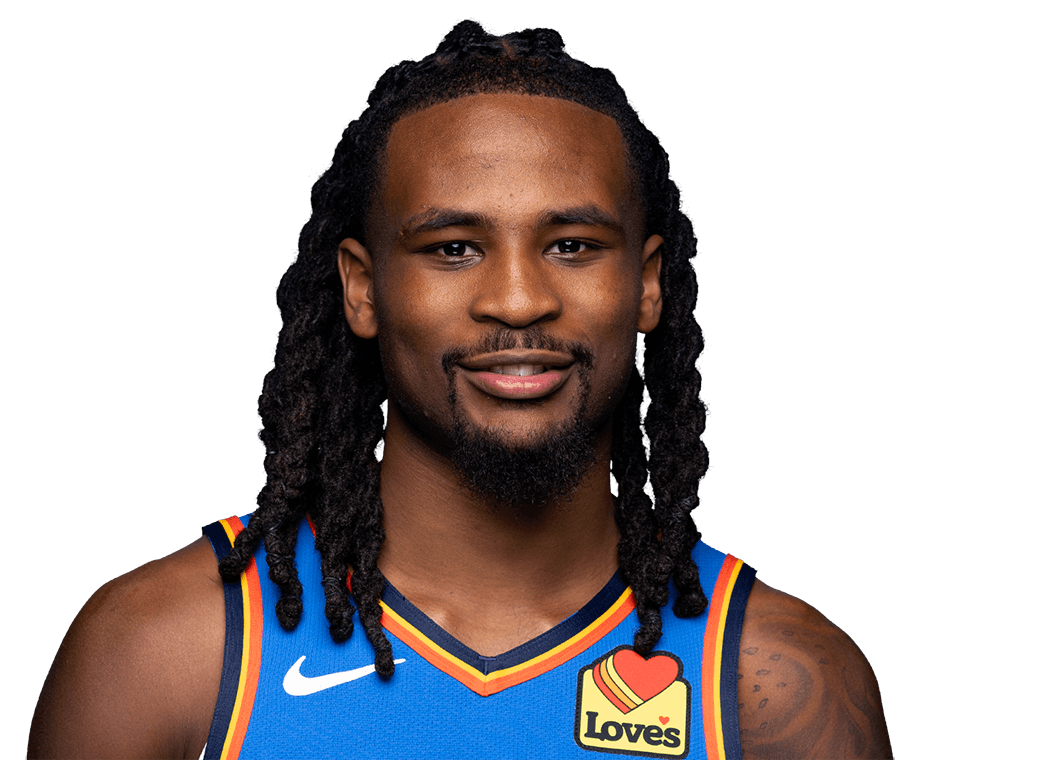 Cason Wallacenew starter NYK 2025-26 → 2026-27
100% started again, 4 games in



Ring Value
We made up a formula to calculate team value. Team value adds up each player’s 9 CAT value above the waiver line (the 156th-best player), weighted by the games he played. Ring Value is a team’s value the season after its title minus its value in the title season. The Oklahoma City Thunder went from 26.4 in 2024-25 to 20.2 in 2025-26.
Why this way: a 9 CAT value is measured against everyone who played that season, so team value is a team’s standing against the league, which is what decides a fantasy matchup.
RingValue[OKC] = TeamValue[2025-26] − TeamValue[2024-25] Input interpretation
- TeamValue
- Σ max(0, v − v₁₅₆) × g ÷ games in the season
- v
- a player’s 9 CAT value per game that season
- v₁₅₆
- the 156th-best player that season, the waiver line: -0.94 in 2024-25, -0.64 in 2025-26
- g
- games he played for OKC
TeamValue[2025-26]
| Shai Gilgeous-Alexander | (12.06 − (-0.64)) × 68 ÷ 82 | 10.54 |
|---|---|---|
| Chet Holmgren | (5.75 − (-0.64)) × 69 ÷ 82 | 5.38 |
| Cason Wallace | (0.88 − (-0.64)) × 77 ÷ 82 | 1.43 |
| Ajay Mitchell | (1.00 − (-0.64)) × 57 ÷ 82 | 1.14 |
| Jalen Williams | (1.74 − (-0.64)) × 33 ÷ 82 | 0.96 |
| Isaiah Hartenstein | (0.72 − (-0.64)) × 47 ÷ 82 | 0.78 |
| 14 more at or below the line | max(0, …) | 0.00 |
| Team value | 20.22 |
TeamValue[2024-25]
| Shai Gilgeous-Alexander | (13.54 − (-0.94)) × 76 ÷ 82 | 13.42 |
|---|---|---|
| Jalen Williams | (4.92 − (-0.94)) × 69 ÷ 82 | 4.93 |
| Isaiah Hartenstein | (2.39 − (-0.94)) × 57 ÷ 82 | 2.31 |
| Chet Holmgren | (3.69 − (-0.94)) × 32 ÷ 82 | 1.81 |
| Cason Wallace | (1.07 − (-0.94)) × 68 ÷ 82 | 1.66 |
| Luguentz Dort | (0.36 − (-0.94)) × 71 ÷ 82 | 1.13 |
| Alex Caruso | (0.56 − (-0.94)) × 53 ÷ 82 | 0.97 |
| Aaron Wiggins | (-0.78 − (-0.94)) × 76 ÷ 82 | 0.15 |
| 11 more at or below the line | max(0, …) | 0.00 |
| Team value | 26.37 |
Ring Value[OKC] = 20.2 − 26.4 = −6.1
From title season to the run-it-back season
Team value to date after every game. The faded line is the title season; hover a game to compare the two. NYK 2026-27 is from ESPN box scores so far.
Choose a game to compare the same point in each season. Faded: title season. Bold: following season.
Denver Nuggets2022-23 → 2023-242022-23: 16.9 · 2023-24: 22.5
After 4 games, 2023-24 is 33% ahead of the title season at the same point.
Boston Celtics2023-24 → 2024-252023-24: 33.7 · 2024-25: 32.3
After 4 games, 2024-25 is 4% behind the title season at the same point.
Oklahoma City Thunder2024-25 → 2025-262024-25: 31.6 · 2025-26: 28.9
After 4 games, 2025-26 is 9% behind the title season at the same point.
New York Knicks2025-26 → 2026-272025-26: 24.4 · 2026-27: 10.1
Title defence: 4 games completed. Its line stops there.
Ring Value, player by player
A fantasy league is not about the NBA team, it’s about the players. So we extend the formula to focus on the individual: his value above the waiver line times the share of the season he played, the season after minus the title season, measured wherever he played. Missed games count against him.
RingValue[player] = max(0, v − v₁₅₆) × g ÷ 82, season after − title season9 CAT value per game for every title rotation player of DEN, BOS, OKC, the title season on the left and the season after on the right, where 0 is an average rotation player. The biggest moves are named; hover any line for the numbers. A player who moved on is measured with his new team.
| DEN | 2022-23 | Ring Value | 2023-24 |
|---|---|---|---|
| Nikola Jokić | 10.269 games | +2.3 | 12.579 games |
| Jamal Murray | 2.965 games | +1.1 | 4.059 games |
| Kentavious Caldwell-Pope | 2.176 games | −0.4 | 1.776 games |
| Aaron Gordon | 0.968 games | −0.5 | 0.473 games |
| Michael Porter Jr. | 2.262 games | +1.0 | 3.281 games |
| Bruce Brownleft for IND/TOR | 1.480 games | −1.4 | 0.067 games |
| Bones Hylandleft for LAC | 0.056 games | +0.0 | 0.037 games |
Best mover: Nikola Jokić +2.3 Ring Value
2022-23Championship season · 69 games
- FG%
- 63.2%
- FT%
- 82.2%
- 3PM
- 0.8
- PTS
- 24.5
- REB
- 11.8
- AST
- 9.8
- STL
- 1.3
- BLK
- 0.7
- TO
- 3.6
2023-24Following season · 79 games
- FG%
- 58.3%
- FT%
- 81.7%
- 3PM
- 1.1
- PTS
- 26.4
- REB
- 12.4
- AST
- 9.0
- STL
- 1.4
- BLK
- 0.9
- TO
- 3.0
Worst mover: Bruce Brown −1.4 Ring Value
2022-23Championship season · 80 games
- FG%
- 48.3%
- FT%
- 75.8%
- 3PM
- 1.1
- PTS
- 11.5
- REB
- 4.1
- AST
- 3.4
- STL
- 1.1
- BLK
- 0.6
- TO
- 1.5
2023-24Following season · 67 games
- FG%
- 47.8%
- FT%
- 82.4%
- 3PM
- 0.8
- PTS
- 10.8
- REB
- 4.2
- AST
- 2.9
- STL
- 0.9
- BLK
- 0.3
- TO
- 1.3
Season averages per game. Shooting percentages use total makes and attempts. Green indicates an improvement, including fewer turnovers.
| BOS | 2023-24 | Ring Value | 2024-25 |
|---|---|---|---|
| Jayson Tatum | 6.874 games | −0.4 | 6.472 games |
| Jaylen Brown | 2.570 games | −0.7 | 1.863 games |
| Jrue Holiday | 2.669 games | −1.3 | 1.362 games |
| Derrick White | 5.473 games | −0.5 | 4.976 games |
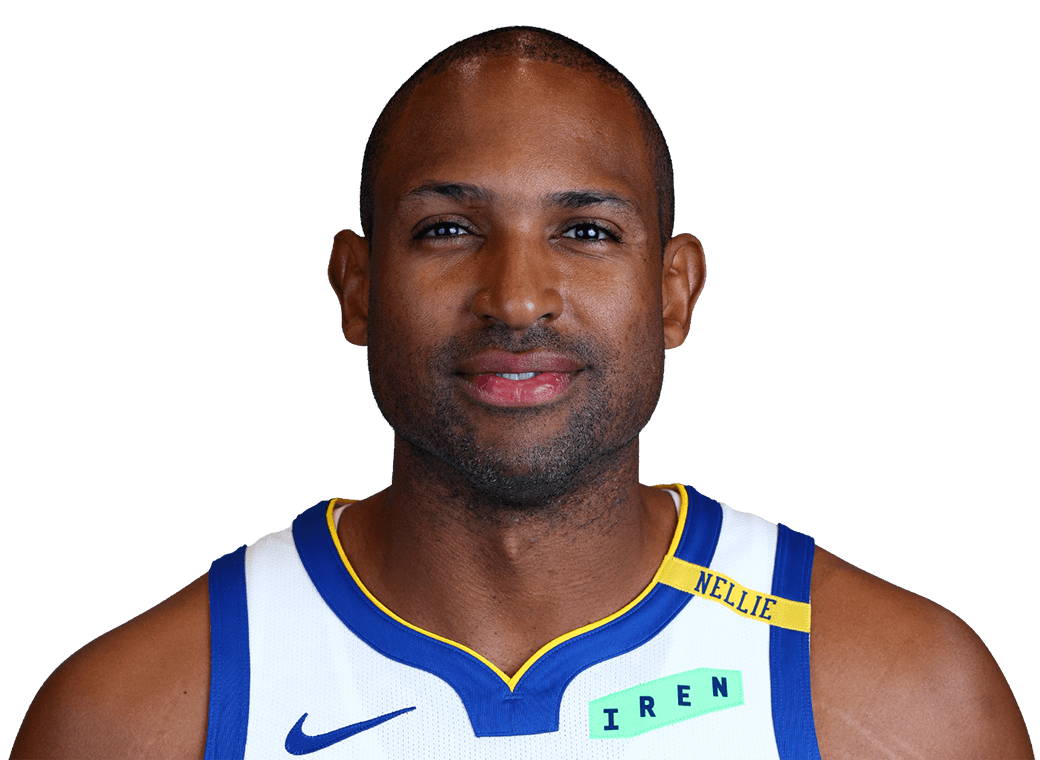
| Al Horford | 2.065 games | −1.1 | 0.960 games |
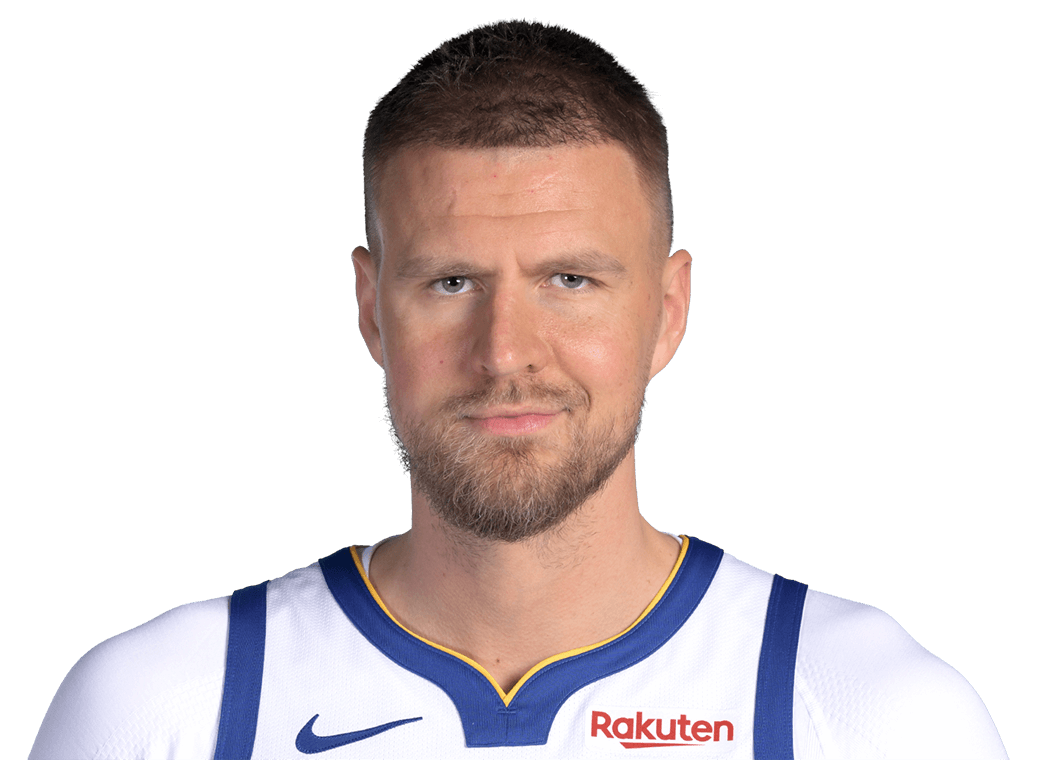
| Kristaps Porziņģis | 5.557 games | −2.4 | 3.142 games |
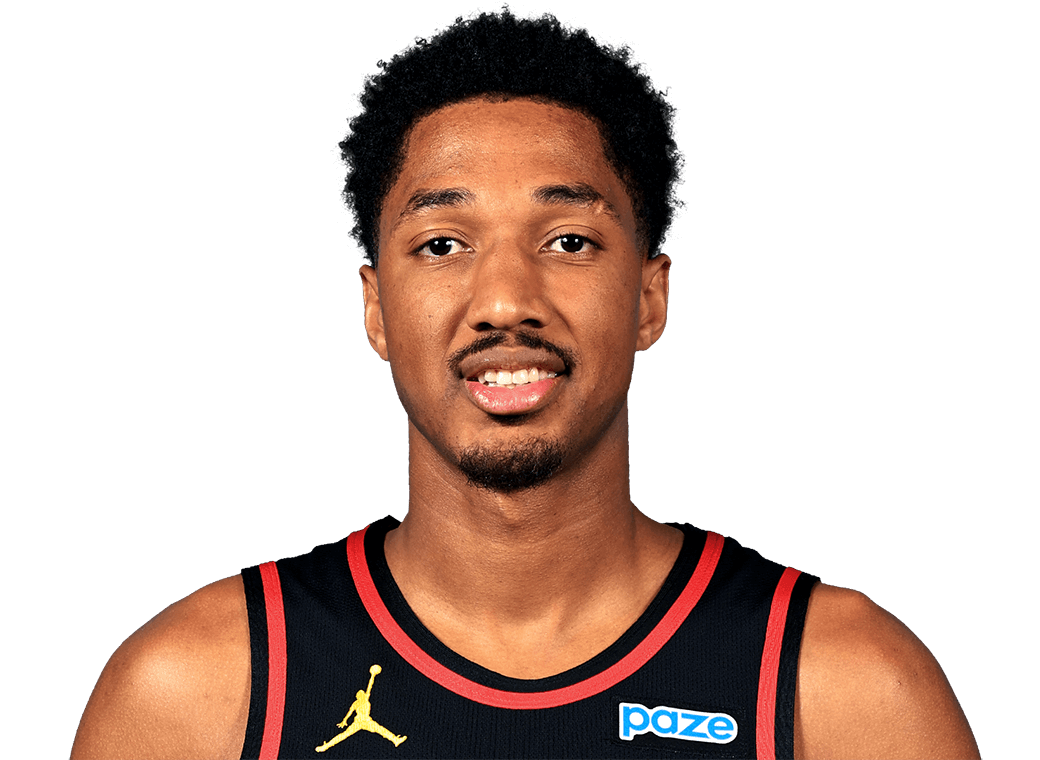
| Payton Pritchard | 0.082 games | +2.7 | 2.780 games |
Best mover: Payton Pritchard +2.7 Ring Value
2023-24Championship season · 82 games
- FG%
- 46.8%
- FT%
- 82.1%
- 3PM
- 1.8
- PTS
- 9.6
- REB
- 3.2
- AST
- 3.4
- STL
- 0.5
- BLK
- 0.1
- TO
- 0.7
2024-25Following season · 80 games
- FG%
- 47.2%
- FT%
- 84.5%
- 3PM
- 3.2
- PTS
- 14.3
- REB
- 3.8
- AST
- 3.5
- STL
- 0.9
- BLK
- 0.2
- TO
- 1.0
Worst mover: Kristaps Porziņģis −2.4 Ring Value
2023-24Championship season · 57 games
- FG%
- 51.6%
- FT%
- 85.8%
- 3PM
- 1.9
- PTS
- 20.1
- REB
- 7.2
- AST
- 2.0
- STL
- 0.7
- BLK
- 1.9
- TO
- 1.6
2024-25Following season · 42 games
- FG%
- 48.3%
- FT%
- 80.9%
- 3PM
- 2.5
- PTS
- 19.5
- REB
- 6.8
- AST
- 2.1
- STL
- 0.7
- BLK
- 1.5
- TO
- 1.3
Season averages per game. Shooting percentages use total makes and attempts. Green indicates an improvement, including fewer turnovers.
| OKC | 2024-25 | Ring Value | 2025-26 |
|---|---|---|---|
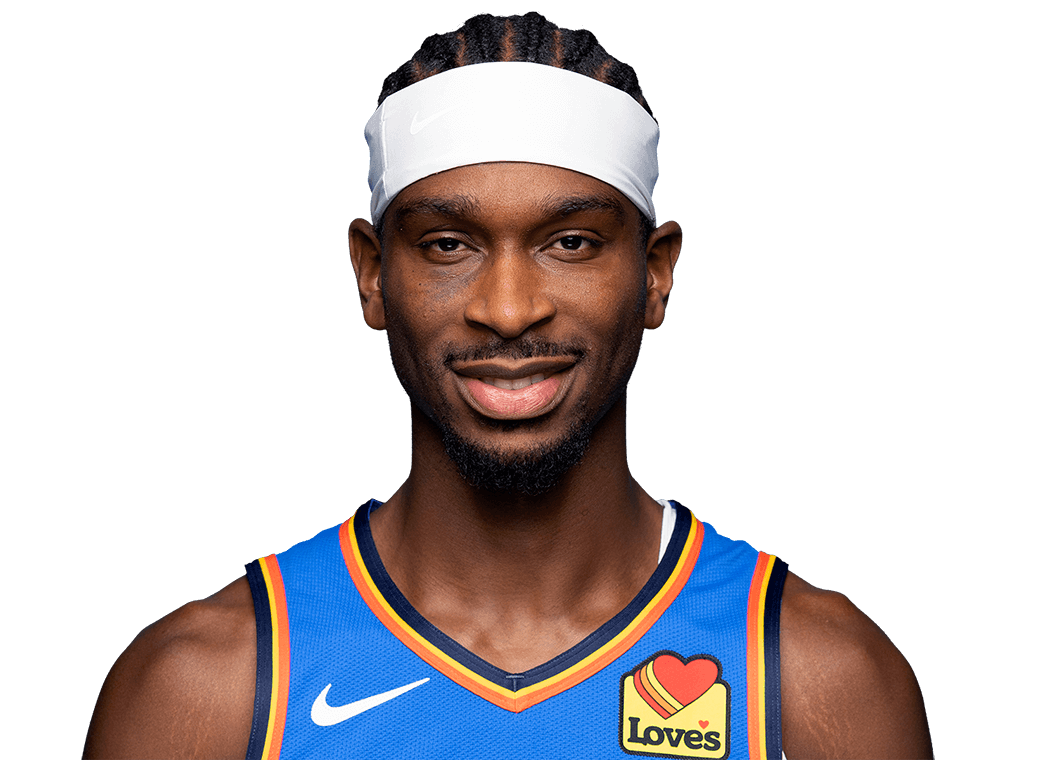
| Shai Gilgeous-Alexander | 13.476 games | −2.9 | 10.568 games |
| Jalen Williamsinjured, 33 games | 4.969 games | −4.0 | 1.033 games |
| Luguentz Dort | 1.171 games | −1.1 | 0.069 games |
| Isaiah Hartenstein | 2.357 games | −1.5 | 0.847 games |
| Chet Holmgren | 1.832 games | +3.6 | 5.469 games |
| Cason Wallace | 1.768 games | −0.2 | 1.477 games |
| Aaron Wiggins | 0.176 games | −0.1 | 0.065 games |
Best mover: Chet Holmgren +3.6 Ring Value
2024-25Championship season · 32 games
- FG%
- 49.0%
- FT%
- 75.4%
- 3PM
- 1.4
- PTS
- 15.0
- REB
- 8.0
- AST
- 2.0
- STL
- 0.7
- BLK
- 2.2
- TO
- 1.8
2025-26Following season · 69 games
- FG%
- 55.7%
- FT%
- 79.2%
- 3PM
- 1.3
- PTS
- 17.1
- REB
- 8.9
- AST
- 1.7
- STL
- 0.6
- BLK
- 1.9
- TO
- 1.6
Worst mover: Jalen Williams −4.0 Ring Value
2024-25Championship season · 69 games
- FG%
- 48.4%
- FT%
- 78.9%
- 3PM
- 1.8
- PTS
- 21.6
- REB
- 5.3
- AST
- 5.1
- STL
- 1.6
- BLK
- 0.7
- TO
- 2.2
2025-26Following season · 33 games
- FG%
- 48.4%
- FT%
- 83.7%
- 3PM
- 0.7
- PTS
- 17.1
- REB
- 4.6
- AST
- 5.5
- STL
- 1.2
- BLK
- 0.3
- TO
- 1.9
Season averages per game. Shooting percentages use total makes and attempts. Green indicates an improvement, including fewer turnovers.
| NYK | 2025-26 | Ring Value | 2026-274 games |
|---|---|---|---|
| Jalen Brunson | 3.774 games | −3.7 | 0.04 games |
| OG Anunoby | 3.867 games | −3.3 | 0.44 games |
| Mikal Bridges | 4.282 games | −4.2 | 0.04 games |
| Karl-Anthony Towns | 5.375 games | −1.5 | 3.84 games |
| Josh Hart | 1.766 games | +4.1 | 5.84 games |
| Miles McBride | 0.041 games | +0.0 | 0.04 games |
| Landry Shamet | 0.051 games | +0.0 | 0.04 games |
Best mover: Josh Hart +4.1 Ring Value
2025-26Championship season · 66 games
- FG%
- 50.8%
- FT%
- 72.0%
- 3PM
- 1.5
- PTS
- 12.0
- REB
- 7.4
- AST
- 4.8
- STL
- 1.1
- BLK
- 0.3
- TO
- 1.9
2026-27Following season · 4 games
- FG%
- 44.4%
- FT%
- 66.7%
- 3PM
- 2.3
- PTS
- 10.8
- REB
- 7.8
- AST
- 3.5
- STL
- 2.8
- BLK
- 0.3
- TO
- 2.0
Worst mover: Mikal Bridges −4.2 Ring Value
2025-26Championship season · 82 games
- FG%
- 49.0%
- FT%
- 82.7%
- 3PM
- 1.9
- PTS
- 14.4
- REB
- 3.8
- AST
- 3.7
- STL
- 1.3
- BLK
- 0.8
- TO
- 1.0
2026-27Following season · 4 games
- FG%
- 27.3%
- FT%
- —
- 3PM
- 1.0
- PTS
- 5.5
- REB
- 3.0
- AST
- 2.5
- STL
- 0.5
- BLK
- 0.5
- TO
- 0.8
Season averages per game. Shooting percentages use total makes and attempts. Green indicates an improvement, including fewer turnovers.
Standouts
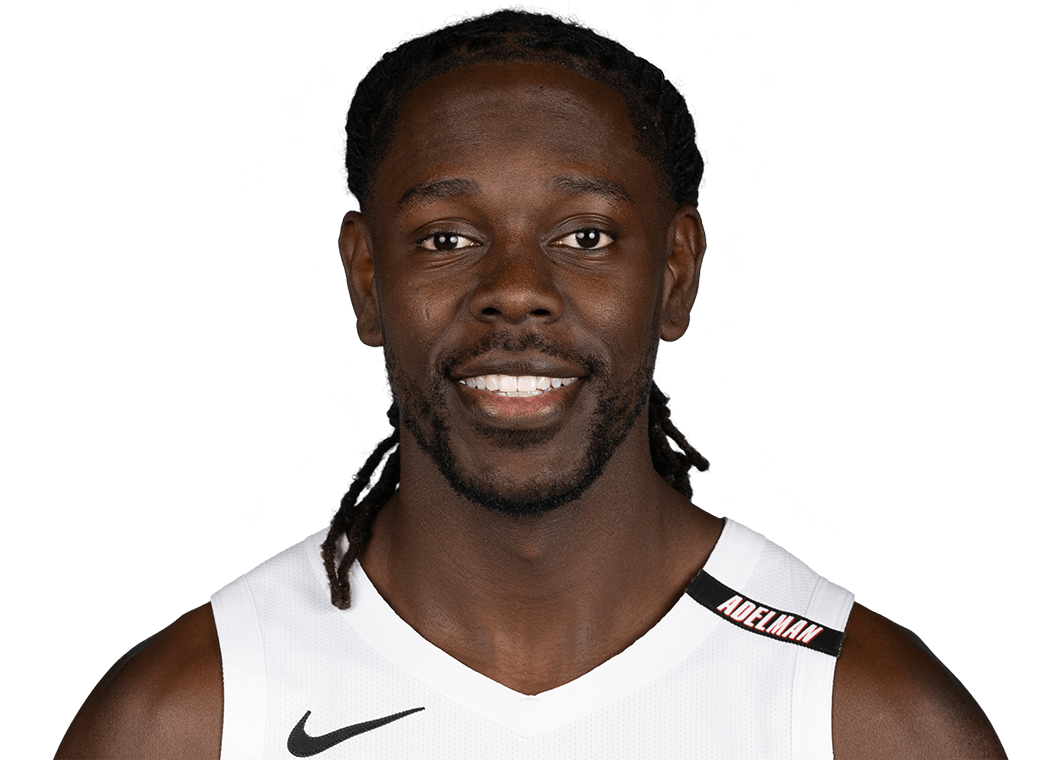
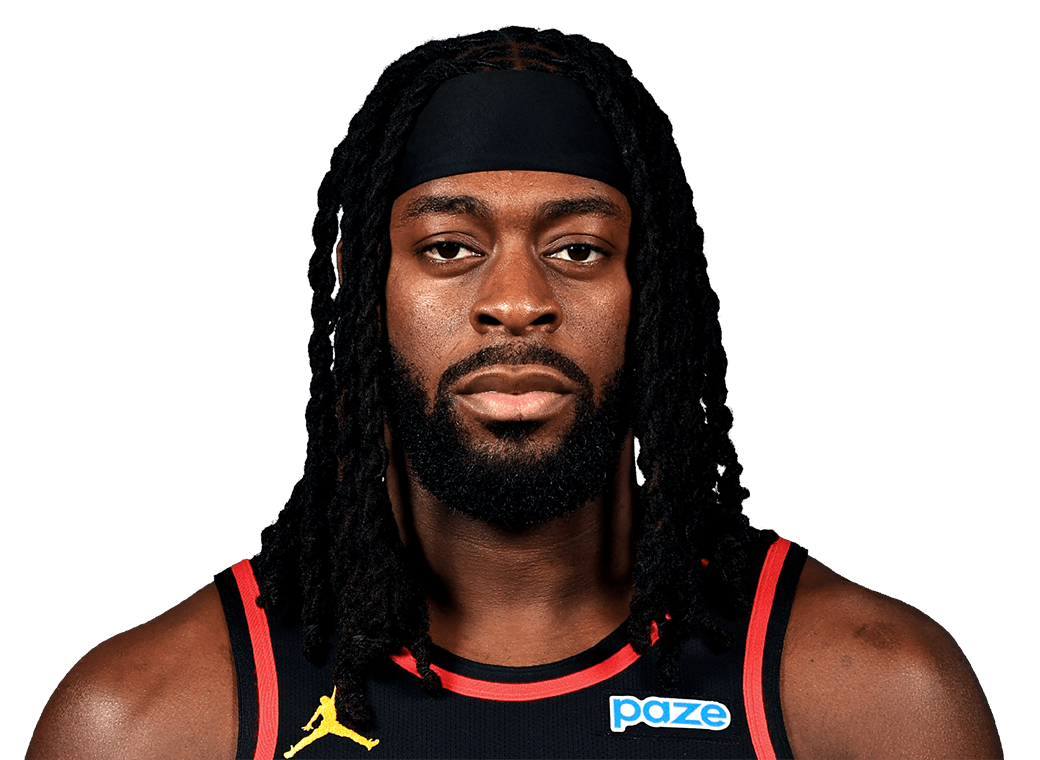
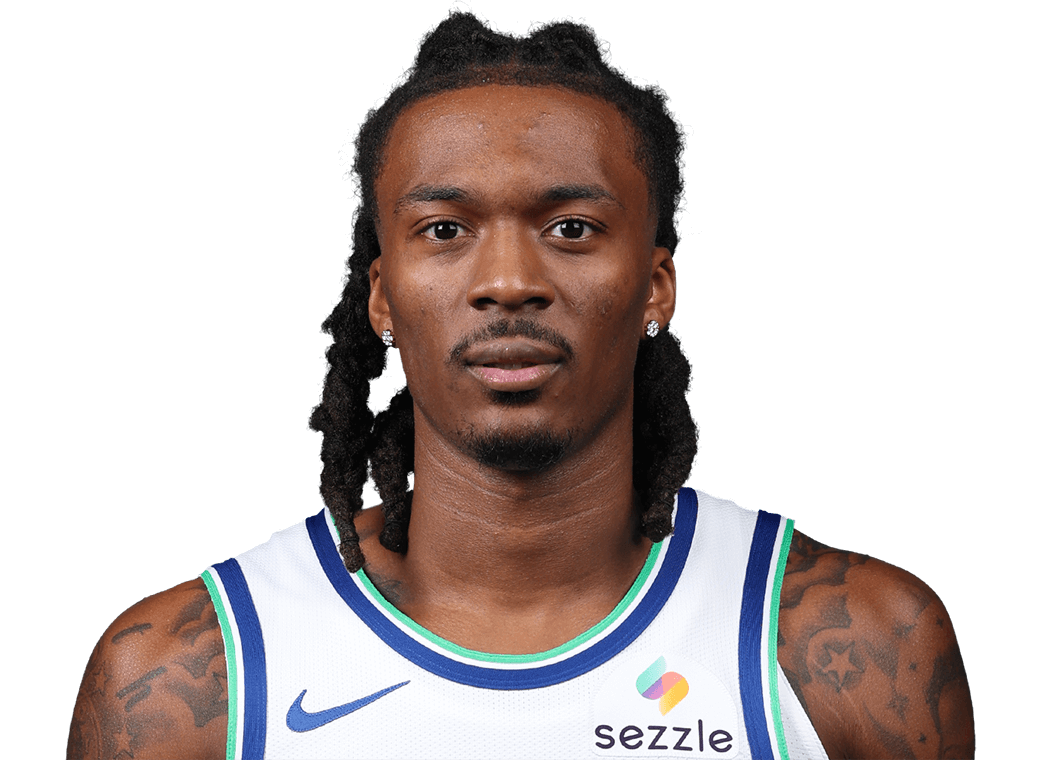
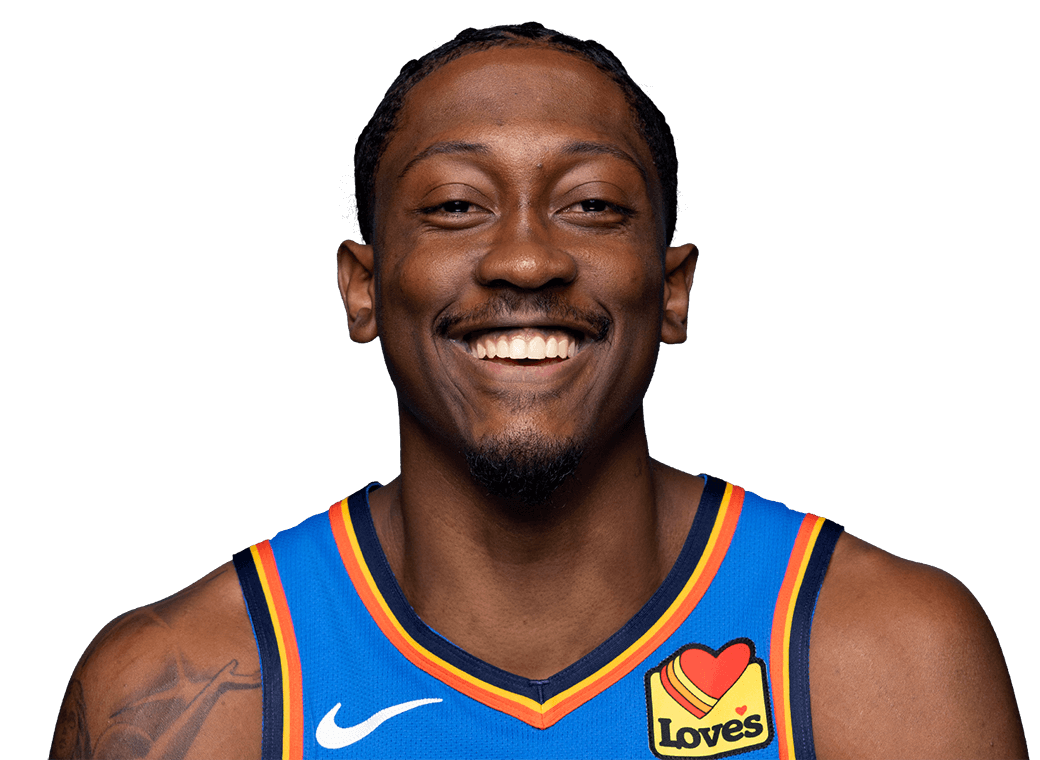
Floor time decided it. Players handed a bigger role or back from a short season rose most (+2.1 and +2.1 a game). Players whose minutes held barely moved (+0.9 and −0.9). The falls grew with the floor time lost: a smaller role −1.9, a new team −2.3, an injury −3.2. Position doesn’t split them: guards, wings and bigs are on both sides.

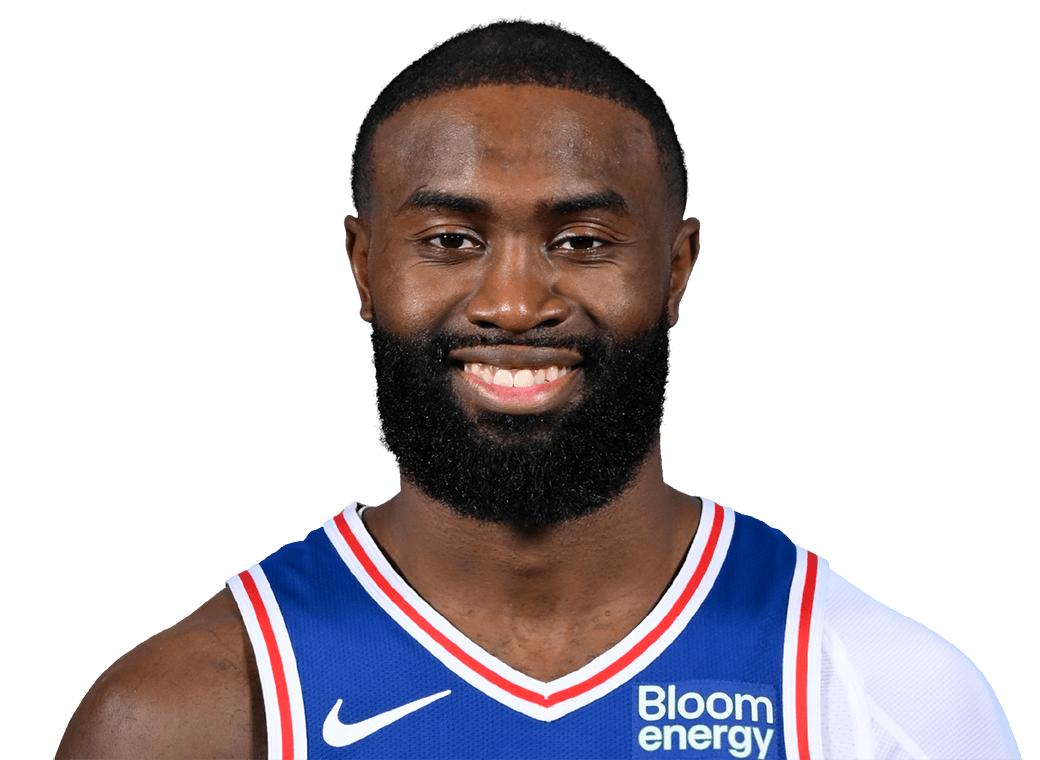
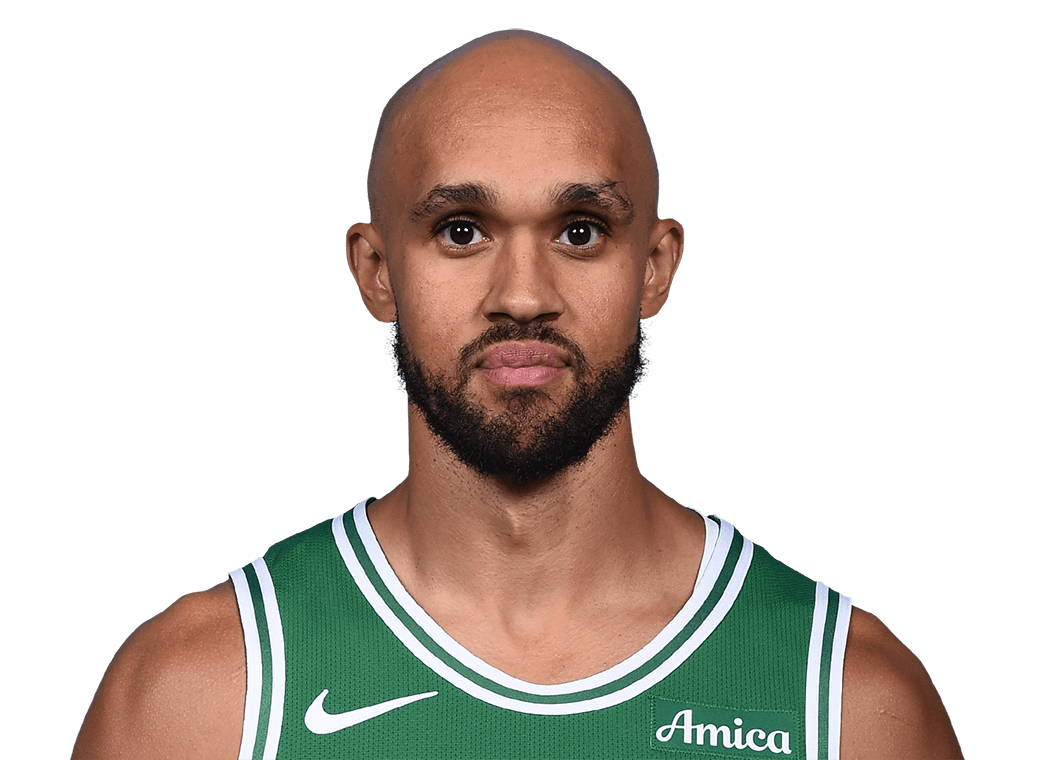
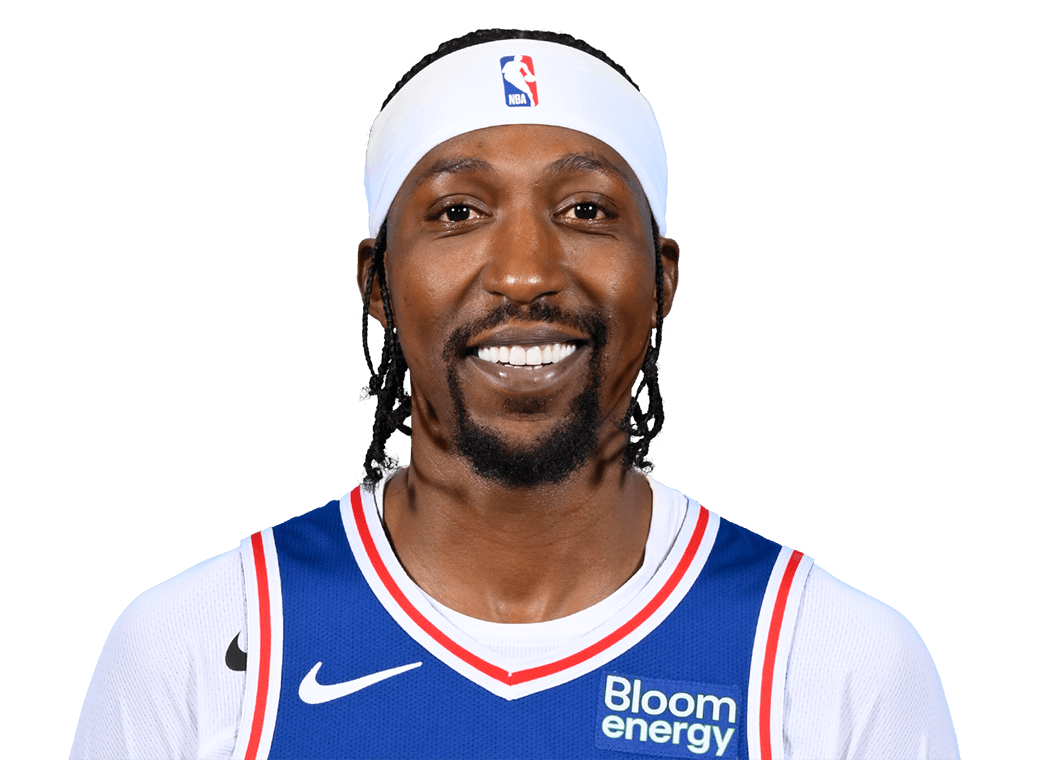
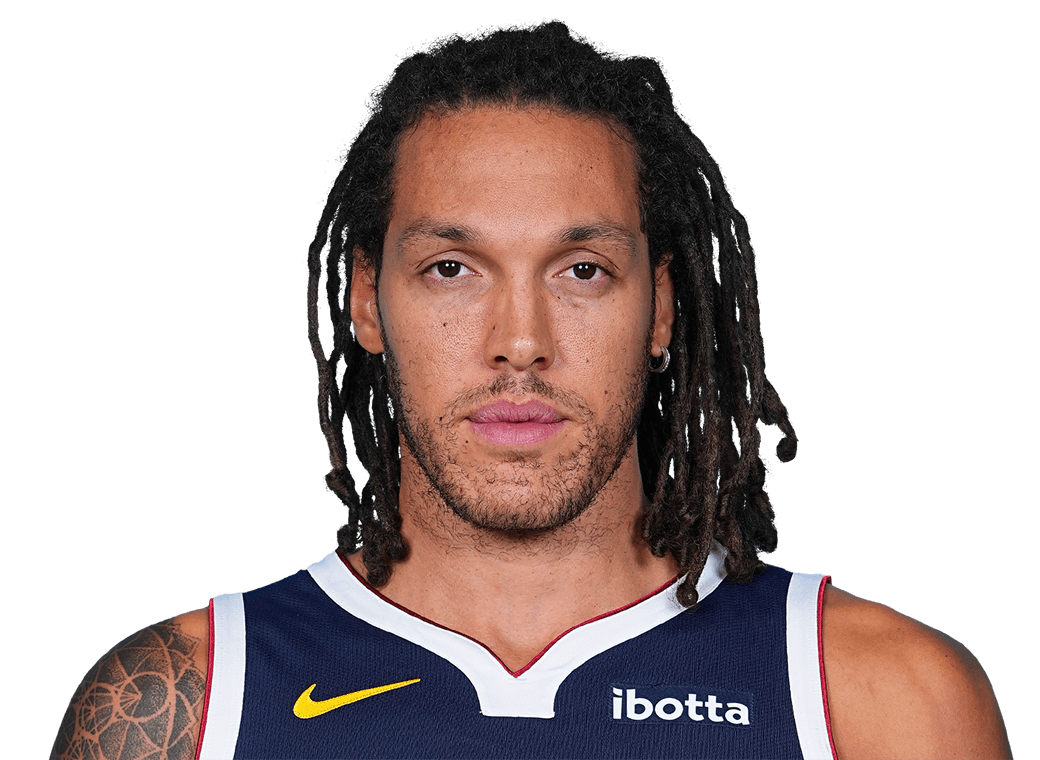


Should I draft a championship starter?
A starting spot on a championship team earns no automatic draft premium. In these three completed follow-up seasons, 5 of 15 title starters improved per game, but only 4 delivered more season Ring Value. These are three teams, not a forecast of any player’s odds.
The five starters who improved per game did not all get a clearer path to minutes. Here is how their minutes per game changed, and who stayed, left or joined behind them.
Jamal Murray DEN · 2022-23 → 2023-24
Per game +1.8 · Season Ring Value +1.1
32.8 → 31.5 minutes per game
Backups: Bruce Brown left; Reggie Jackson stayed.
Nikola Jokić DEN · 2022-23 → 2023-24
Per game +0.8 · Season Ring Value +2.3
33.7 → 34.6 minutes per game
Backups: DeAndre Jordan stayed; Zeke Nnaji stayed.
Michael Porter Jr. DEN · 2022-23 → 2023-24
Per game +0.2 · Season Ring Value +1.0
29.0 → 31.7 minutes per game
Backups: Peyton Watson stayed; Jeff Green left; Justin Holiday joined.
Jayson Tatum BOS · 2023-24 → 2024-25
Per game +0.1 · Season Ring Value −0.4
35.7 → 36.4 minutes per game
Backup: Sam Hauser stayed.
Chet Holmgren OKC · 2024-25 → 2025-26
Per game +2.1 · Season Ring Value +3.6
27.4 → 28.9 minutes per game
Backup: Jaylin Williams stayed.
The reason to move a player up is a better opportunity or availability outlook at his draft price. The cases above tell you what to check: a backup leaving, a backup developing, a returning player’s health, or a changing share of the minutes. They also show why an unchanged roster alone is not enough. Tatum improved per game and still lost season value; Murray improved with fewer minutes; Porter and his backup both played more.
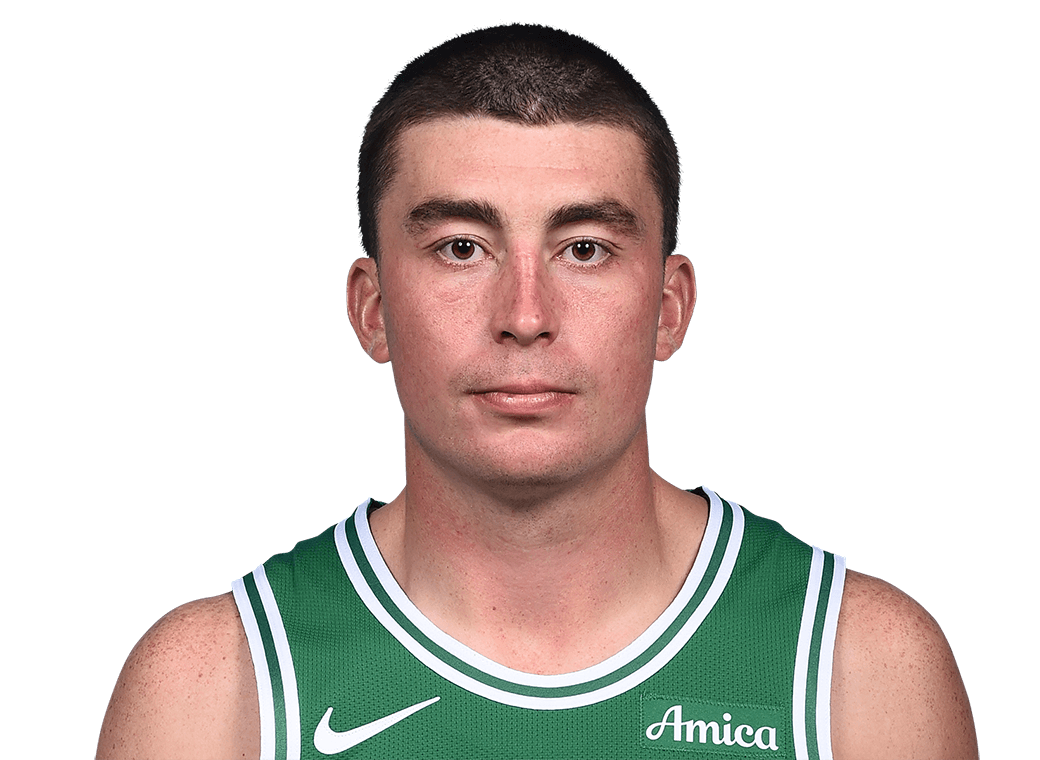
Aging can shift opportunity towards a younger reserve, but age alone does not tell us who gets it. Boston’s Pritchard/Holiday example below is a change to investigate in the rotation, not proof that winning a title caused it.
When the backup gains
Bringing back the same starting five does not mean bringing back the same distribution of minutes and shots. Boston kept its title five, yet Pritchard went from 22.3 to 28.4 minutes a game while Holiday went from 32.8 to 30.6. Pritchard’s Ring Value rose +2.7.
For the Knicks, 4 games is still an opening sample. The question as this post updates is whether their roles are changing, or whether the same players are simply producing different numbers in the same roles.
Data and methods
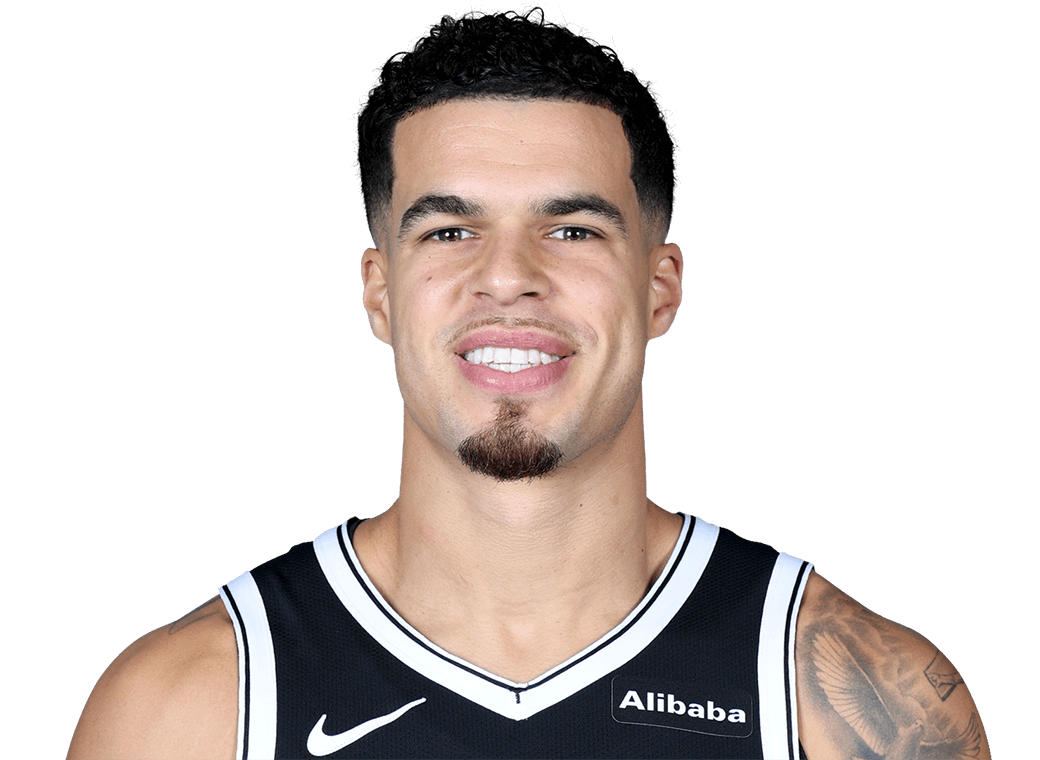
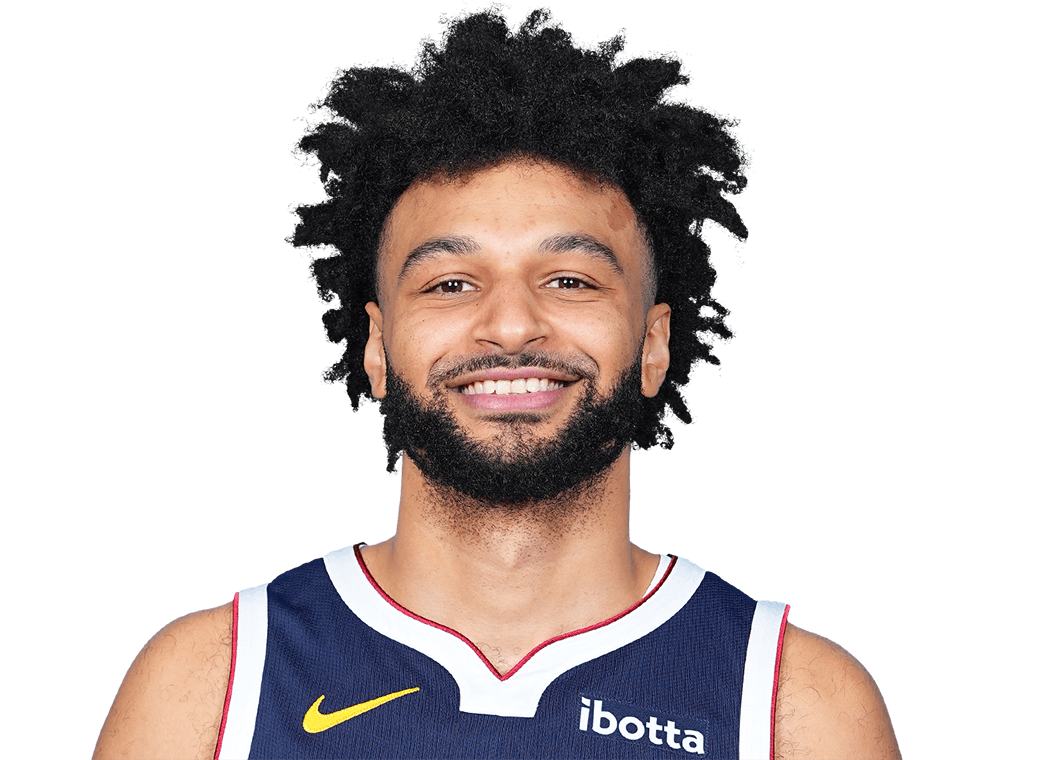
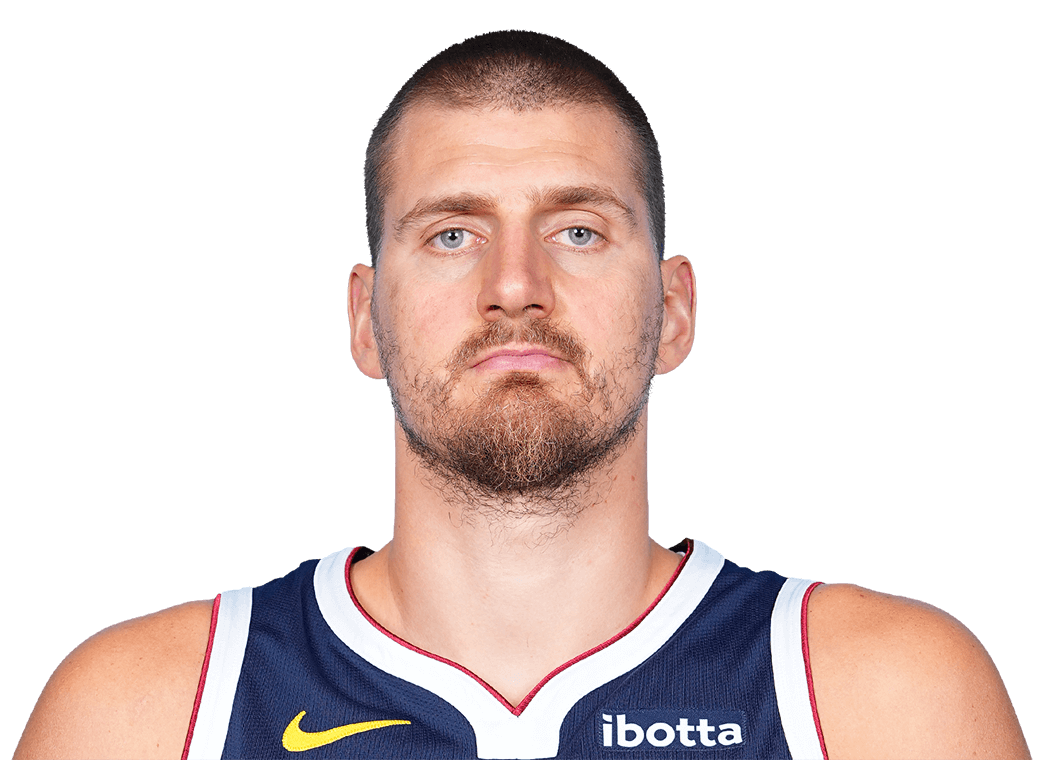
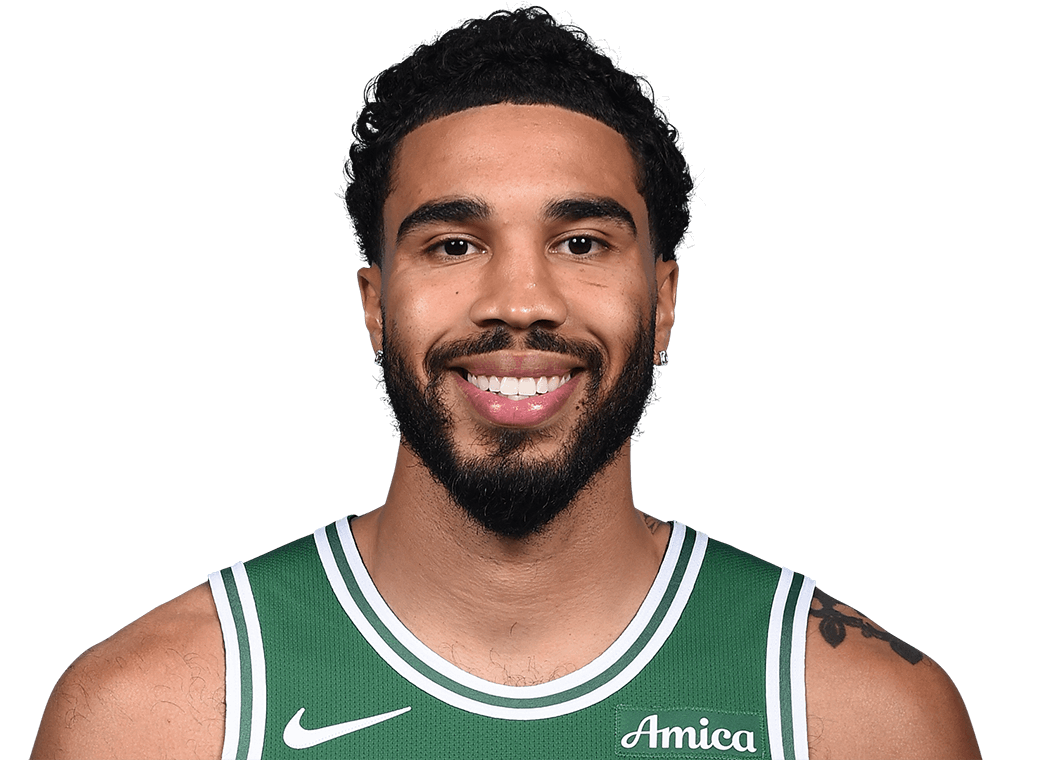
Data from basketball-reference.com (season totals and the title playoff starters), ESPN (box scores, game by game, and the starters of each season after) and NBA.com (headshots).
A player’s value per game is the site’s 9 CAT z-score sum, with FG% and FT% weighted by attempts and turnovers counted against, measured against his own season’s league. The 2026-27 season is only 4 games old, too few to make a league of its own, so its games are measured against last season’s league.
The waiver line is the 156th-best player with at least 20 games that season (12 teams with 13 active slots), and anyone below it counts as zero. A player’s Ring Value is his value above the line multiplied by the share of the season he played (games ÷ 82), in the season after minus the same in the title season, wherever he played. For example, Jalen Williams played 33 games in 2025-26, so his 1.0 counts for far less than the 4.9 he gave the Oklahoma City Thunder in their title season, a Ring Value of −4.0.
The question came from a fantasy manager in our league early in the 2026-27 season, lamenting the New York Knicks’ poor start to their title defence.
A team’s value is the same sum over everyone who played for the team that season, counting only his games for that team. The rotation players in the charts are the title five plus anyone with 20 games and 15 minutes a game for the champion, up to seven a team; the title five are the five players with the most playoff starts.